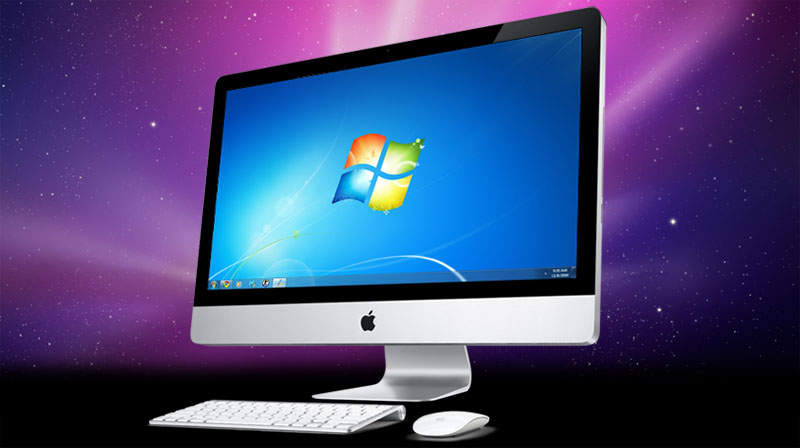
How to install Windows 7 on your Mac: The Complete Walkthrough
Using Boot Camp to install Windows 7 on your Mac: The Complete Walkthrough

Somewhat similar to the Using Boot Camp to install Vista on your Mac walkthrough, this tutorial will take you every step of the way through installing Microsoft Windows 7 on your Intel Mac (running 10.5 or later), using Boot Camp.
Note: if you’d rather not dual boot OS X and Windows 7, you can always install Windows 7 in a virtual environment using Parallels Desktop 6.0 for Mac.
To install Windows 7 on your Mac using Boot Camp you will need the following:
All firmware updates installed on your Mac (use Apple Button -> Software Update… to check)
A Windows 7 installation DVD
Your OS X Leopard or Snow Leopard installation DVD
Around 30GB of empty hard drive space on your Mac. You can probably get away allocating less than 30GB to Windows 7, but it will leave very little room to install anything in Windows.
An hour if all goes well, up to 5 hours if not
Though not absolutely required, it’s a VERY good idea to have a complete and up to date Time Machine backup of OS X – it really came in handy for me. Because part of the process involves partitioning your drive, there’s always the distinct chance something will go wrong and everything will be wiped out.
Patience, possibly a great deal of it. Having a book handy will also help kill time during the partitioning, installing etc).
Installing Windows 7 via Boot Camp
Here goes. First thing – close absolutely every open program you can. That includes those things running in the Apple Menu that you always forget about. Don’t worry about killing the Dock or Dashboard – having those running is fine.
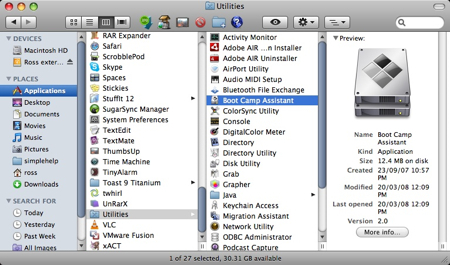
Now open a Finder and navigate to Applications -> Utilities and double-click Boot Camp Assistant. 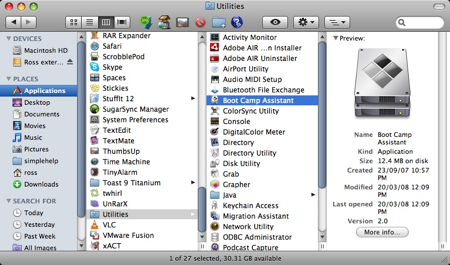
Click Continue on the initial Introduction screen. Ignore the fact that it doesn’t mention Windows 7 as a possible OS to install.
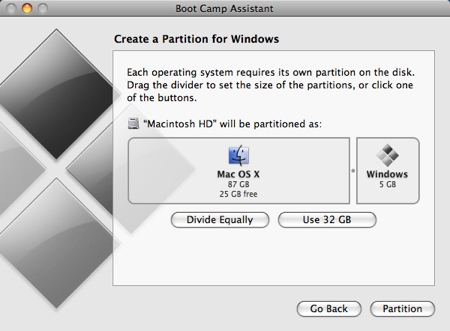
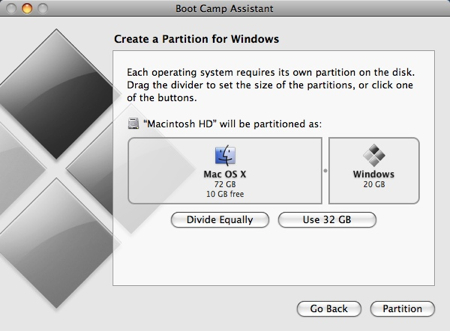
Now you have to decide how much space you want to allocate to Windows 7. You might be able to get away with going as low as 10GB, but I would highly advise against it. You’ll have almost no space left over to install software, and your page file in Windows might cause frequent crashes. I opted for 20GB, which left me with just a bit over 16GB to use after installing Windows 7.
To change the amount of space to dedicate to Windows 7, click the small divider between Mac OS X and Windows, and drag it to the left. 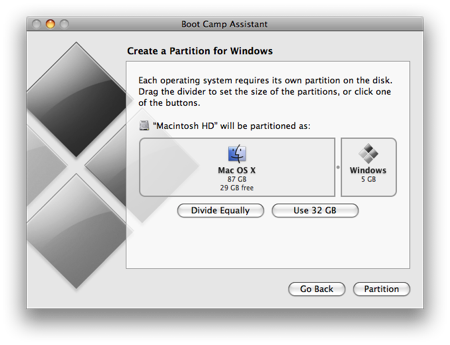
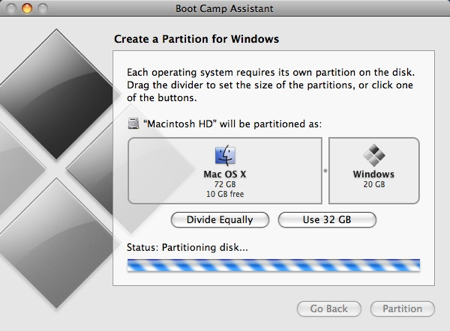
Once you’ve determined how much space you want to allocate to Windows 7, click the Partition button.
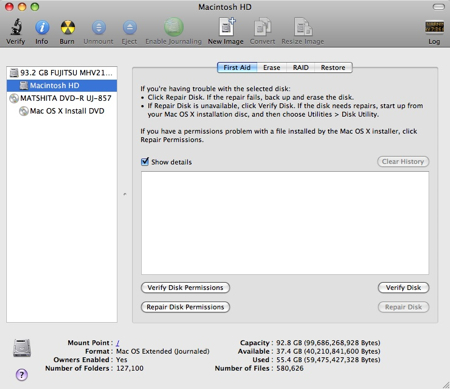
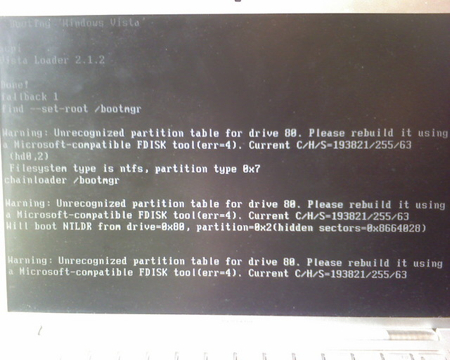
The partitioning itself doesn’t take particularly long. If you receive an error, proceed to step 10 of the “How to install Vista with Boot Camp” tutorial. It provides all the troubleshooting info you need to resolve partitioning issues. Once you’ve cleared up any problems, or if everything just goes smoothly, proceed with the next step in this tutorial. 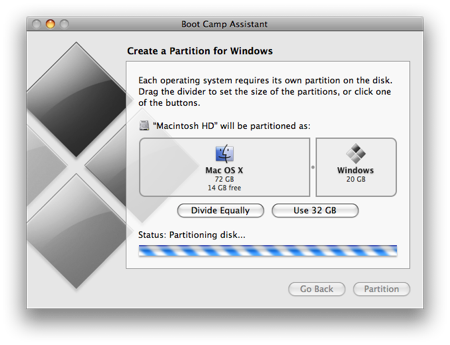
Once completed you’ll notice a new BOOTCAMP drive on your desktop. 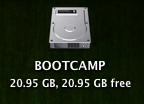
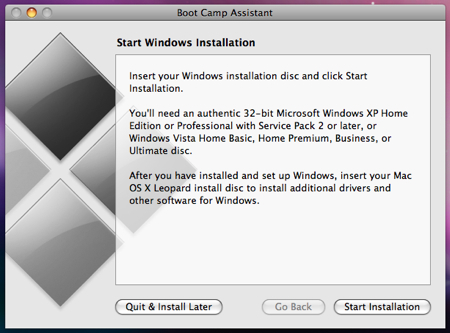
Now insert your Windows 7 DVD and click the Start Installation button.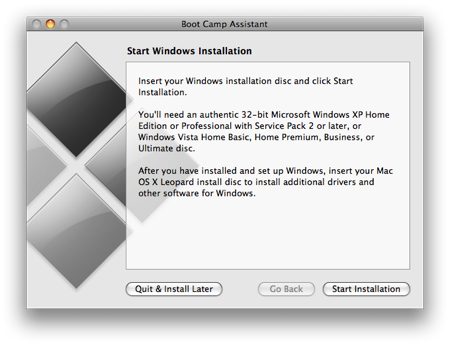
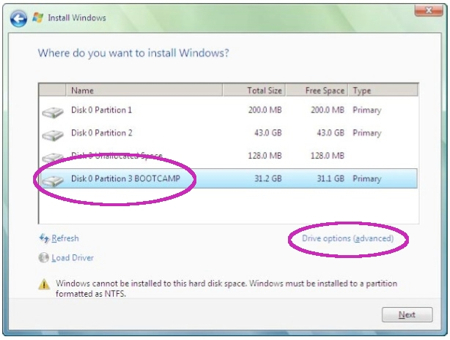
Your Mac will restart, and Windows 7 will boot. You’ll be prompted with a window asking you which partition you want to install Windows on. Select the one with BOOTCAMP in the Name column. Selecting anything else may wipe out OS X or cause serious problems. Then select the Drive options(advanced) link. 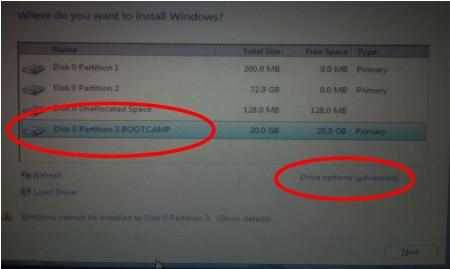
With the BOOTCAMP volume still selected, click the Format link.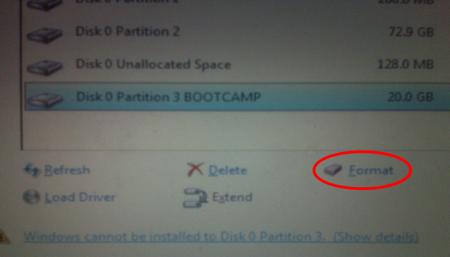
Click OK. 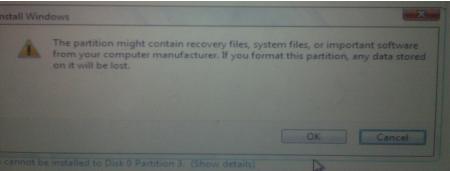
And Windows 7 will begin to install. It’s a fairly boring process, so you may want to grab yourself a cup of coffee or your beverage of choice. But don’t go too far away, because when your system reboots, you’ll need to remove the Windows 7 DVD. 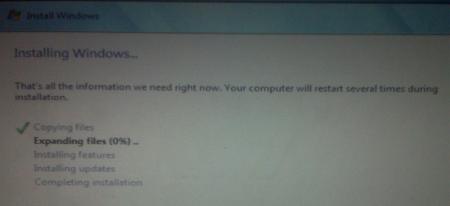
With the Windows 7 DVD removed, your Mac will automatically boot back into Windows 7, and the installation will complete. You’ll be prompted to select your language, keyboard layout etc. The rest of the Windows 7 installation process is very straight forward.
Once the installation has completed and your Mac has restarted again, you’ll be able to use Windows 7. WiFi will work immediately (no drivers to install) so connect to the Internet. Windows 7 will then begin to download updates, including the proper video card driver. Let it do its thing. 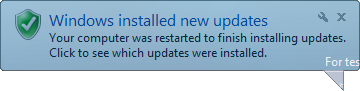
Once completed, you’ll be prompted to reboot yet again. Do so.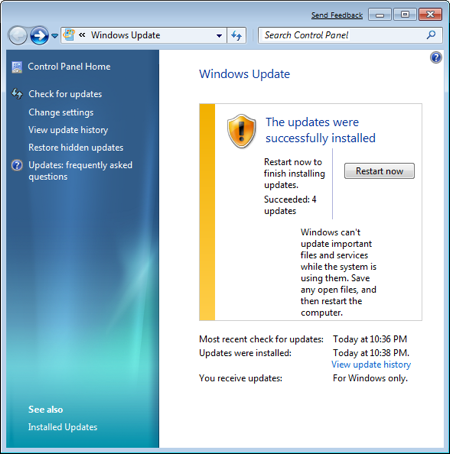
Once Windows 7 boots back up again, you’ll notice the resolution is much better, and you can enable the advanced graphics features. 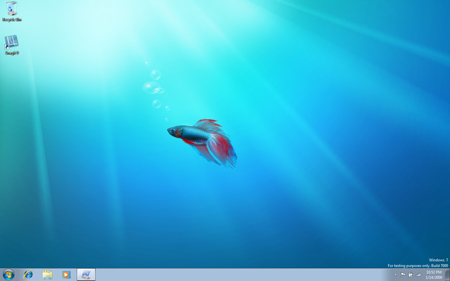
But if you check for sound, you’ll notice there are no sound drivers installed. 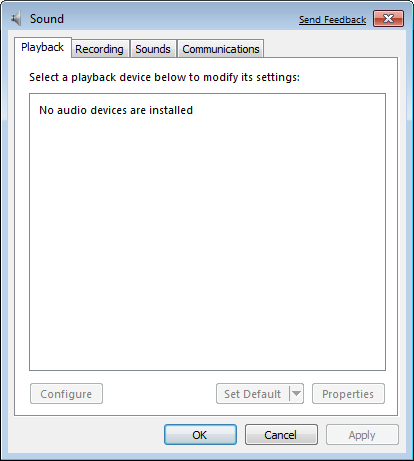
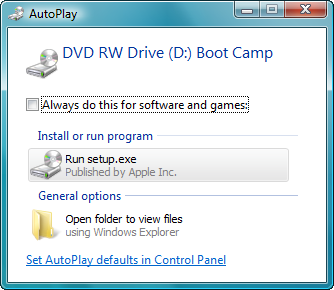
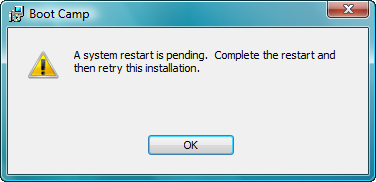
Insert your OS X Leopard (or Snow Leopard) DVD. When prompted, select Run setup.exe. Note: If you’re using Snow Leopard and a message pops up saying “Remote Install Mac OS X”, close that window and eject the CD. Put the CD in again and this time select “Open folder to view files”, navigate to the Bootcamp folder, and run setup.exe. 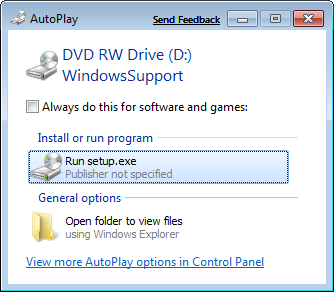
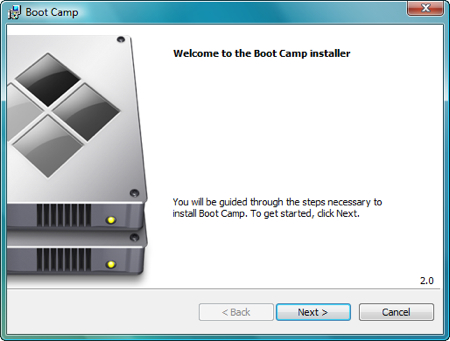
The Boot Camp installer will launch. Click Next to begin. 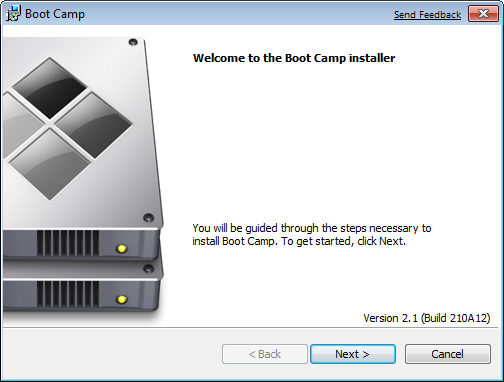
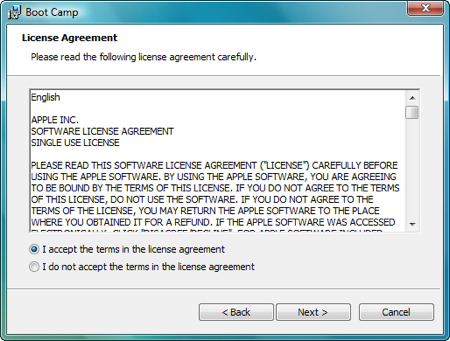
Select I accept the terms in the license agreement and then click Next again. 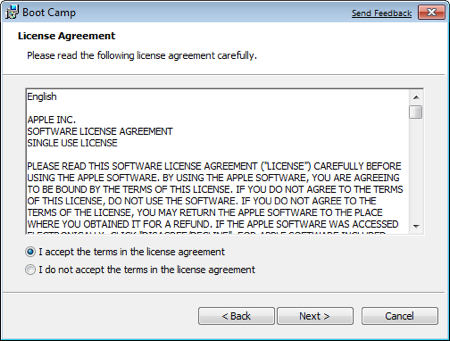
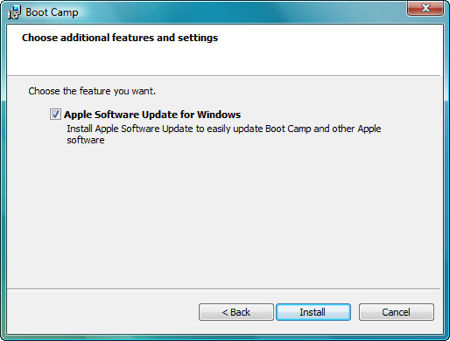
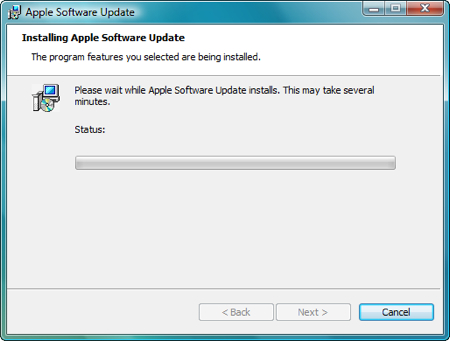
Make sure that Apple Software Update for Windows is checked, and click Install. 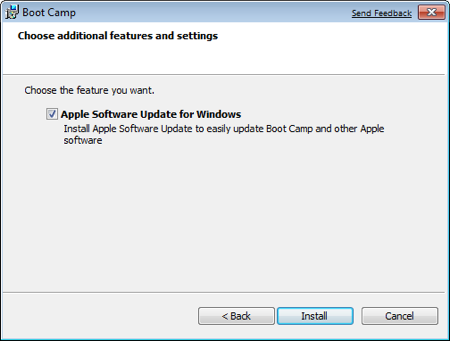
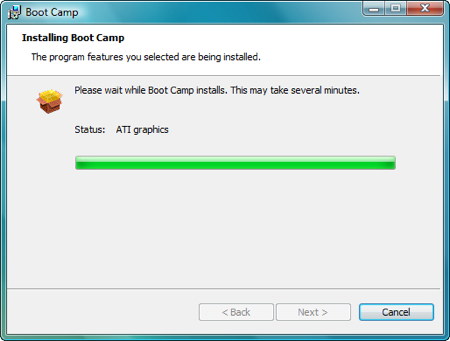
The Boot Camp installer will do its thing, and install all the required drivers. 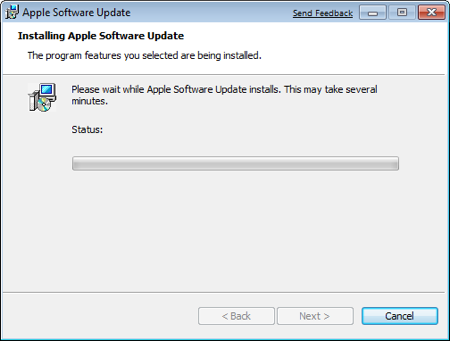
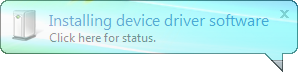
Notifications will pop up with each driver that gets installed.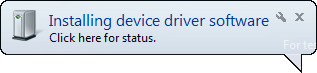
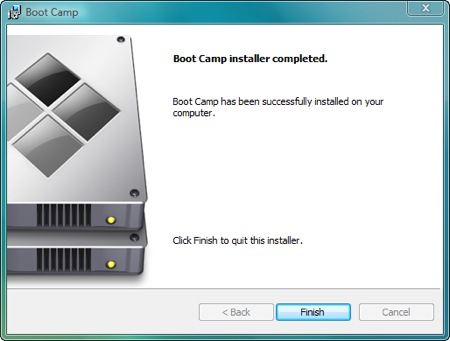
Once completed, click Finish. 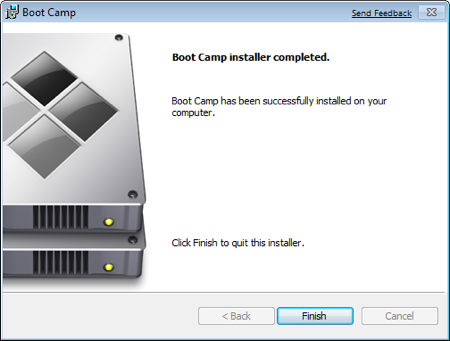
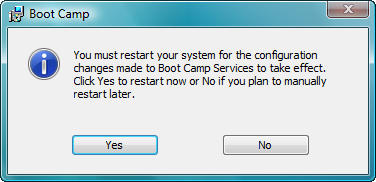
And yet again you’ll be prompted to reboot. Remove your OS X Leopard DVD from the drive, and click Yes to restart. 
At this point most of the hardware on your Mac should be working in Windows. However, some iMacs and MacBook Pro’s will have to update to the 3.1 version of Boot Camp for Windows. To do so, just follow the few steps in this tutorial.
Note: If you still have problems with sound not working, you’ll need to install the Realtek drivers.
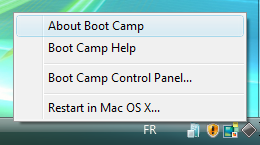
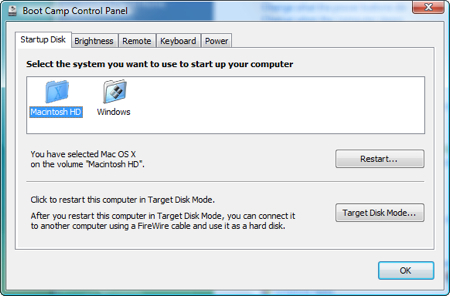
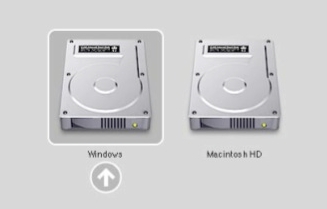
That’s it, you’re done! When your Mac boots, hold down the Option key to select which Operating System you want to boot into. 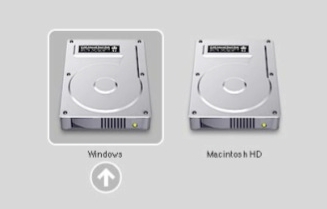
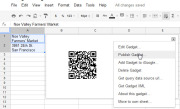
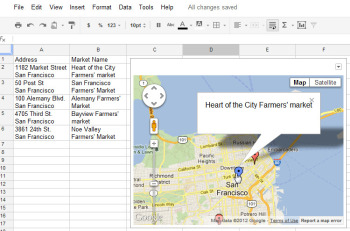 The Map gadget uses content from Google Maps to display the addresses you have entered as markers on the map.Pictures convey more information than words do, and a map offers the easiest way to show people where your office and other places of interest are located. The Map gadget lets you create a custom Google Map with pointers to the places you want to highlight, and it’s simple to use. To begin, type a list of addresses, one per row down a single column. If you want a tooltip to appear over the map location when someone hovers over the marker, type the text for this item in the cell to the right of the address. For example, to produce a map of local farmers’ markets, type each address in one cell and the name of the farmers’ market in the adjoining cell to the right. Choose Insert > Gadget >Maps, and click Add to Spreadsheet. Now select the range of cells containing your address and tooltip data, and then enter a title for the map in the Title box. If your data includes tooltips, select the Last Column as Tooltips checkbox, and then click theZoom Using Mouse Wheel checkbox. From the ‘Map type’ list, select the type of map–Normal is a good choice–and then click Apply & Close. The gadget dialog box will now show a map with the addresses plotted on it. As with the other gadgets, you can publish the Map gadget for use on your website to show your business locations or places of interest to your customers.
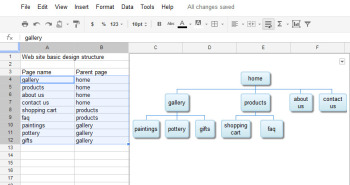 The Organization Chart gadget can create a hierarchical chart showing the design for your website or the management structure of your business.
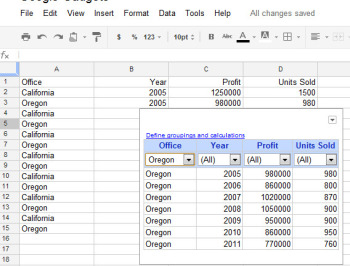 At its simplest, the Table gadget lets you filter data to see a subset of it.The Google Table gadget allows you to analyze data by creating a table that supports filtering, grouping, and even totaling. Insert the gadget by choosingInsert > Gadget > Tables > Add to spreadsheet. Select the range containing your data, including the heading row, and click OK. Click in the Title box and type a title for your tables. Select the checkboxes for Show Filters and Enable Grouping, and then click Apply & Close.To group the data by the contents of column A, for example, click the Define groupings and calculations link, select that column’s heading, and click the arrow to add it to ‘Group by Box’. Click Next, and select a column to calculate. To sum Profit, for instance, set the Profit entry to Total. You can apply calculations to multiple columns, if you desire, or to none at all if you just want to group the data.You’ll see a table appear in the gadget dialog box, with the headings over each column. Use the filter box at the top of each column to filter that column of data. Click OK, and the gadget will show you the grouped data, with any calculations appearing in the row above the appropriate group. You can collapse and expand the groups as necessary to see the values in the table.
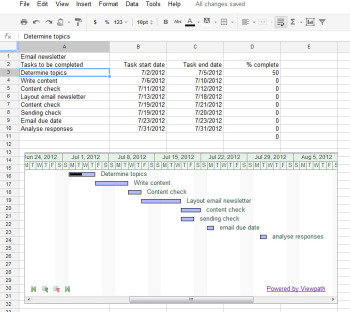 The Gantt Chart gadget illustrates the tasks in a project and the time allotted for each of them.You can use a Gantt chart to display projects involving tasks that must be performed over time. To make this type of chart, you need three columns of data (with an optional fourth column). In the first column, place a list of the individual tasks in the overall project–the steps needed to create and publish an email newsletter, for example. In the second column, place the start date for each task; in the third column, insert the end date for the task. If you wish, you can add a fourth column containing the percentage completed for that task. To produce the Gantt chart, chooseInsert > Gadget > Charts. Locate the Gantt chart and click Add to spreadsheet. Select the data for the tasks, the start and end dates, and the completed percentage, and click OK. Set the Name column to the column containing the task names. Set the Start column, Finish column, and % Complete column to the column letters containing that data (typically columns B, C, and D), and click Apply & Close. The Gantt chart will present the tasks to be completed, their start and end dates, and the progress made toward their completion to date.
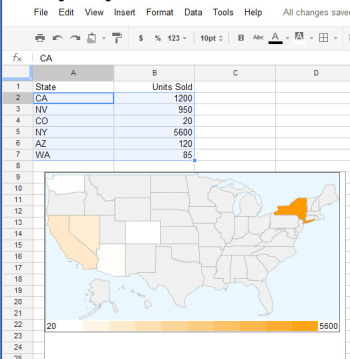 The Heatmap gadget shows relative values as colors on a map.You can plot data related to states or countries on a heat map, with small values indicated by light colors and larger values rendered in darker and more saturated colors. To plot the data correctly, you must use ISO country codes (or, for U.S. states, the usual two-letter state codes). Place the data to plot in the cell to the right of each relevant state or country. Choose Insert > Gadget > Map > Heatmap, and then click Add to spreadsheet. Select the data–including the locations and the data to plot, but not the column headings–and click OK. Type a title for the heatmap in the Title box, select the map type from the Region box (click USA to plot data on a United States map), and click Apply & Close. The map will appear with the regions colored appropriately for the value of the data associated with each.
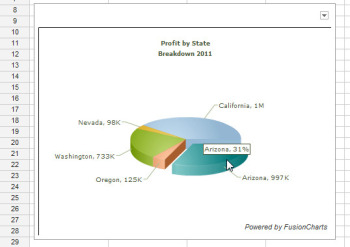 Drag on a pie slice in the animated pie chart to offset it from the chart itself.Interactive charts are more interesting to look at than static graphs. You can create animated pie charts in a Google spreadsheet using a gadget. For this chart, you need only the categories and one set of data, because pie charts can plot only a single data series. Insert the gadget by choosing Insert > Gadget > Charts. Locate the FusionCharts Pie & Donut Widget, and click Add to spreadsheet. Click in the Range box, select the data to plot–omitting the column headings–and click OK. Now select the chart type, such as Pie 3D. Type a caption and subcaption for the chart to inform the viewer as to the information the chart is intended to convey. Enable the Animate checkbox, and, if you prefer, enable Values On and Labels On to show both labels and values for each pie slice. If you enable Tooltips, the mouse pointer will show a tooltip if the user hovers the mouse over a given slice. Select Format Number and set Decimals to No Decimal so that numbers will be constrained in size. Enabling Shorten Values will ensure that the chart presents large values legibly. Click Apply & Close. When the chart appears, you can drag on a pie slice to explode it from the chart. Right-click the chart and click Enable Rotation so that you can then rotate the chart with your mouse. Gadgets such as these add a range of extra functions to Google spreadsheets, allowing you to do new things with your data and display it in ways that can help your business.

 For future purchases, though, Android was clearly the preferred choice, with 44 percent of respondents saying they’d choose a device that uses the Linux-based operating system. Only three percent of respondents said they’d opt for Windows 8, and 21 percent said they weren’t sure. Global Variations The research results are even more interesting when broken down geographically. In Africa, 44 percent indicated they’d choose an Android tablet, compared with only 21 percent planning to buy an iPad. Similarly, in Europe, 23 %of new buyers said they plan to buy an iPad, compared with a full 49 percent who have set their sights on an Android tablet. North America and Australia/New Zealand, interestingly, showed the lowest preference for Android tablets, only 30 percent of North American buyers and 35 percent of those in Australia/New Zealand choosing them over iPads.








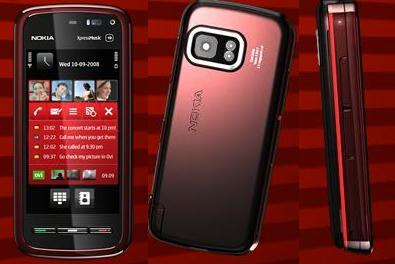
 Nokia, the one of most popular and trusted mobile company. Nokia made wide range of


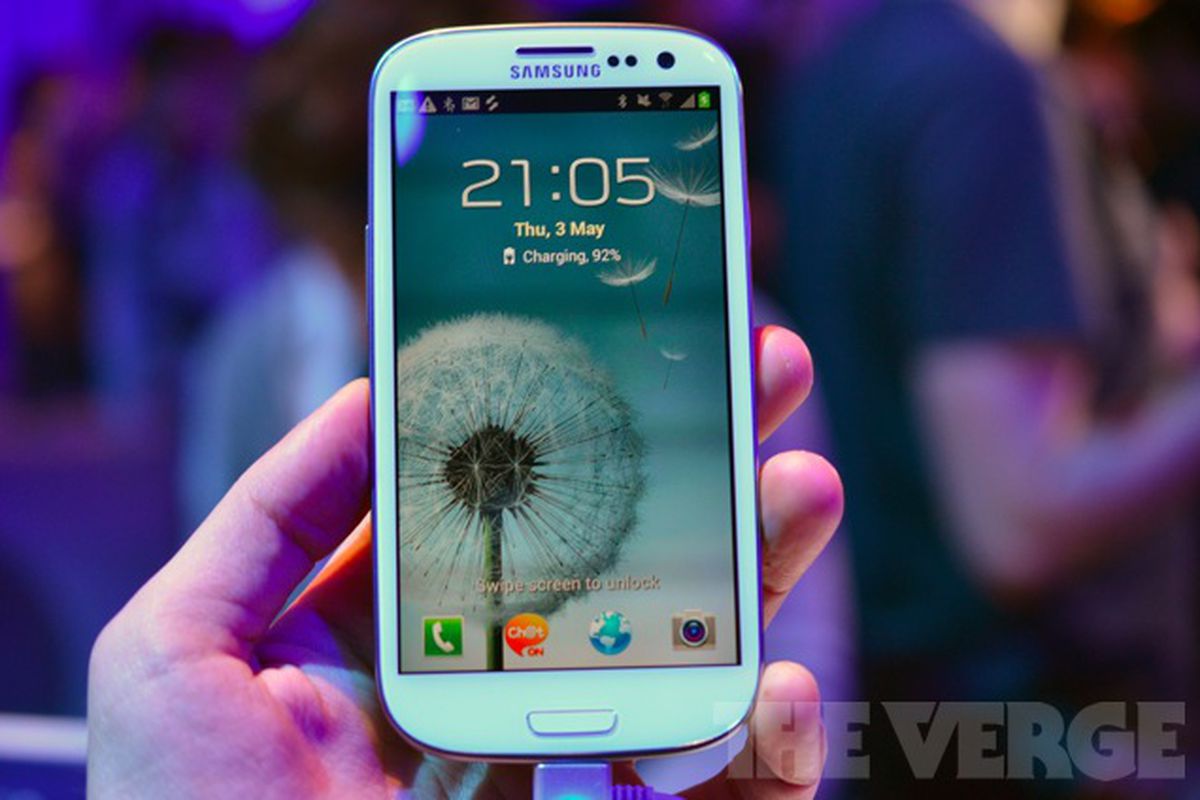
 HTC pulled a similar trick with the One X. The global version runs on an NVidia Tegra 3 processor, while the U.S. phone uses a dual-core Qualcomm Snapdragon S4 processor. NVidia’s quad-core processor was not yet compatible with AT&T’s LTE network at the time of the One X’s manufacture. In our benchmarks, however, the U.S. version of the One X did quite well despite having fewer cores.
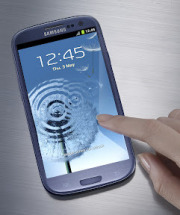 The 3.4-inch-thick S III has a 4.8-inch HD Super AMOLED display with a 1280-pixel by 720-pixel resolution. This is the same display technology we saw on the Galaxy Nexus. The Galaxy S II had Super AMOLED Plus, which is actually based on a PenTile pixel structure in which pixels share subpixels.
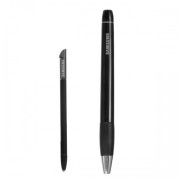 Samsung Galaxy Note S PenSamsung announced a slew of accessories, including a C Pen stylus (which seems pretty similar to the S Pen on the Galaxy Note), an AllShare Cast Hub for wireless streaming, a docking station for your desk, a wireless charger, a car kit, and an HDMI adapter.
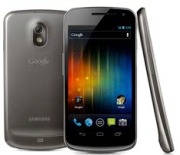 Samsung Galaxy NexusNo, relax. It might not have as many cores as the S III, and the display might be a little smaller, but don’t feel bad if you just walked out of the store with a brand new Galaxy Nexus. Your Galaxy Nexus is still an excellent, current phone and offers something the Galaxy S III does not: A pure, untouched Android experience.
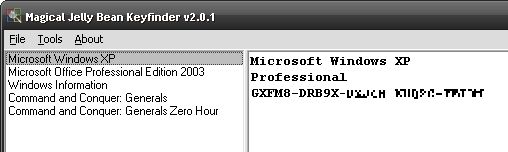 Magical Jelly Bean Keyfinder helps you round up your serial numbers.

 Apple announcement that it’s integrating Facebook into its operating system software should be welcome news for a social network that’s
  While Apple’s move doesn’t offer an answer to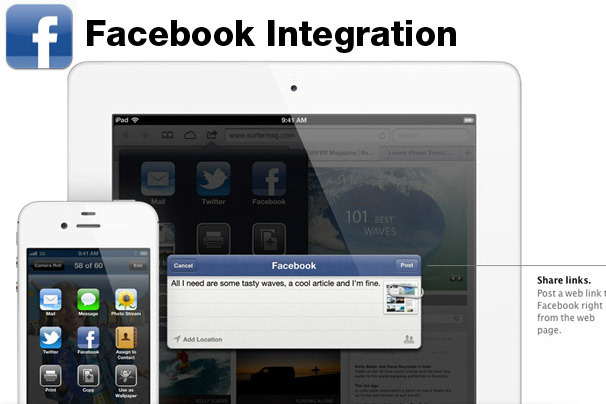








You must be logged in to post a comment.