Benchmarking is the standard by which a PC’s performance is determined.
To thoroughly determine a PC’s performance, you need to use multiple tools and utilities specifically designed to tax each major component. We show you which tools to use, describe how to get results that are reliable and repeatable, and explain what all those numbers mean.
Running benchmarks on a PC enables users to evaluate performance, to identify potential bottlenecks, and to choose effective system upgrades. Unfortunately, many users imagine that system performance is simply a matter of CPU frequency or memory capacity, which leads them to think that dropping in a faster CPU or more memory will automatically and immediately yield noticeable performance improvements. In reality, however, that is not always the case.
Though CPU and memory upgrades help in some situations, it often makes more sense to upgrade the storage subsystem or the graphics board if you’re looking for perceptible improvement in system responsiveness or gaming performance, for example. If you ran a series of benchmarks and identified which components were holding your system back, you’d be able to choose the most effective upgrade for your current system–or determine which components make the most sense in a new system suited to your particular needs.
Several different types of benchmarks are available for evaluating a system’s performance. Some use synthetic tests that don’t necessarily reflect real-world usage, while others employ scripted tests that rely on actual applications and simulated real-world workloads. Some benchmarks assess the performance of a single component, while others measure total system performance. To best gauge the overall performance of a PC, consider running some combination of all of these different types of benchmarks, based on your usage patterns.
Benchmarking Do’s and Don’ts
Before running any benchmarks, you need to consider a number of hardware and software factors, in order to avoid potential damage to your system and to ensure consistent, accurate results. We’ll look at hardware factors first.
Many benchmarks place significant stress on specific components, so you need to ensure that all such components are in good working order, properly cooled (if necessary), and receiving adequate power. If you have a component that seems unstable or unreliable during normal, day-to-day use, subjecting it to a taxing benchmark could kill it. Also, an inadequately cooled or underpowered device that works most of the time may become unstable under stress. That said, we’ve run benchmarks for many years, and have had only a handful of components fail due to the demands of a benchmark test–and those components were likely defective to begin with.
On the software front, parameters for the operating system, applications, and drivers must be satisfied to ensure accurate, repeatable benchmark results. Windows (and other) operating systems proactively prefetch data and store numerous temporary files that could interfere with a benchmark, so it’s best to clear out any temporary files and prefetch data before running a test. In Windows 7, you can find prefetch data in C:WindowsPrefetch, and temporary files in C:WindowsTemp and C:Users[username]AppDataLocalTemp. If you have applications running, it may not be safe (or possible) to delete all temporary files, so restart your system and shut down any applications that may be running in the background before wiping out any temporary files.
You don’t want applications or utilities that may be running in the background to interfere with the benchmark, so shut them down. This is especially important in connection with antimalware utilities, remote desktop tools, and downloaders that intermittently consume CPU, memory, and storage resources and steal application focus. Unless you’re testing a system as it shipped from an OEM to evaluate the effects of background applications on performance, shut them down before running the tests. In the same vein, most operating systems load multiple services and perform maintenance during the initial boot process. Consequently, after boot-up, it’s best to let the system “settle” and reach an idle state, with no drive or CPU activity, before you run a test.
Using the correct (typically the latest) drivers for a component is another important step to take to ensure that it is operating and performing optimally. This is especially true of graphics boards and motherboards/chipsets, where the wrong driver can significantly worsen the system’s frame rates or transfer speeds and latency. Finally, confirm that the operating system is fully updated and patched to ensure optimal compatibility and to reflect the current, real-world OS configuration–not the OS as it may have shipped years ago.
Benchmarking Individual Components
Many components in a system contribute to its overall performance, but the CPU/processor, memory, graphics board, and storage configuration generally play the largest roles for most users. Which of these components is the most important in a particular case depends on the individual person’s usage patterns, however. A gamer seeking the best possible frame rates, for example, will probably be better served by a faster GPU than by more memory. A casual user seeking a more responsive system may benefit most by upgrading a slow hard drive to a fast solid-state drive. You must decide which aspects of system performance are most important to you, tailor the suite of benchmarks to your specific needs, and then weigh the individual test results accordingly.
CPU/Processor
The most useful CPU benchmarks place a heavy workload on the CPU while minimizes the influence of other system components. SiSoft’s SANDRA 2012 incorporates a few CPU-centric synthetic benchmarks that test a chip’s performance with various mathematical workloads. The tests are multithreaded and generally scale with higher-clocked speeds and more CPU cores. SANDRA also provides results from other CPUs for easy comparison.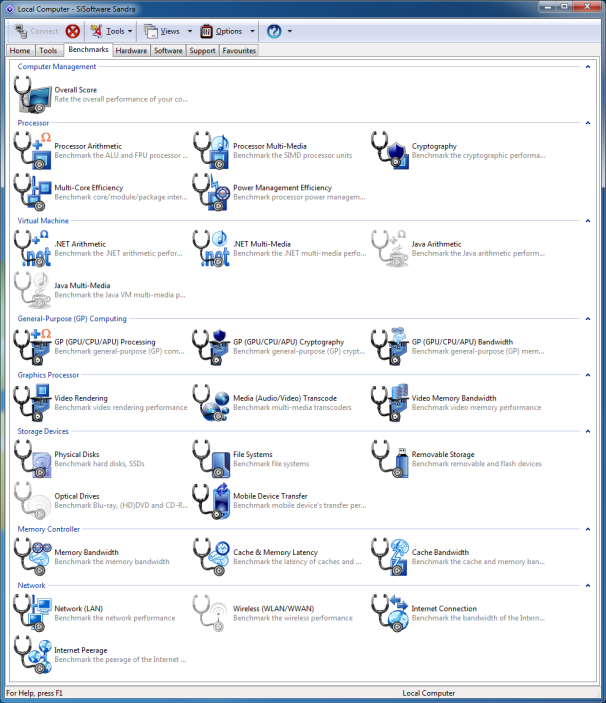
Utilities like SiSoft’s SANDRA 2012 incorporate various easy-to-use, synthetic benchmarks for testing the performance of different system components.
Another popular CPU benchmark is Cinebench. Cinebench renders a 3D scene using the animation engine from Maxon’s Cinema 4D. Cinebench is free, works with multiple operating systems, and can run in single-threaded mode (to test the performance of a single CPU core) or in multithreaded mode (to tax all of the cores in a CPU). If all is working properly, an Intel Core i7-2700K will score about 1.55 in Cinebench’s (R11.5) single-threaded test and about 7.05 in its multithreaded test.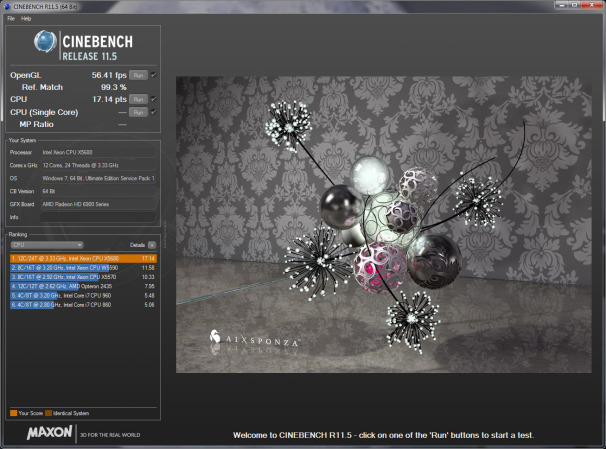 Maxon’s Cinebench, based on the company’s Cinema 4D animation software, tests single-threaded and multithreaded CPU performance.
GPU/Graphics Board
Myriad graphics-related benchmarks are available for testing a GPU’s performance. Many games have built-in tools to test performance; and you can test games that don’t with a utility called Fraps that shows real-time frame rates and tracks performance over time. Many synthetic and “canned” graphics benchmarks don’t use actual game engines to test performance, but produce comparable results nonetheless.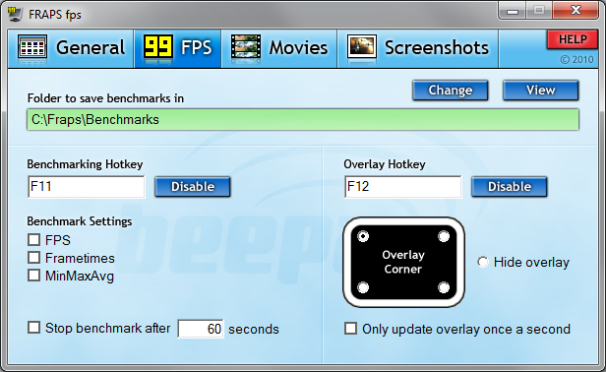 Fraps tests how well a game is performing on your system, even if the game doesn’t offer a built-in benchmark.
For testing a GPU’s performance, we recommend using a mixture of synthetic and real-world tests to see how the GPU handles a range of different workloads. Futuremark’s 3DMark 7 is a popular tool that provides an overall 3DMark score, as well as numerical results for each of the individual tests that contribute to the final score. Another handy synthetic benchmarking is Unigine Heaven. Heaven can test a GPU’s performance using DirectX 9, 10, or 11 or OpenGL paths, with varying levels of image quality and tessellation. Heaven’s results identify both an overall score and a frame rate.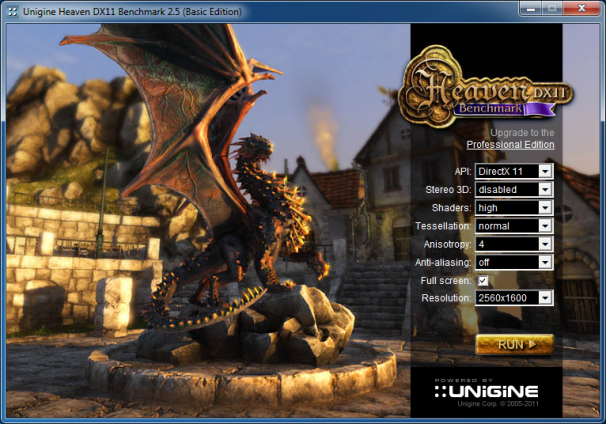 The Unigine Heaven benchmarking tests GPU performance in multiple DirectX or OpenGL modes.
In a system powered by an Intel Core i7-3960X, when tested at a resolution of 1920 by 1200 with 4X MSAA, 16X anisotropic filtering, and high tessellation, an Nvidia GeForce GTX 560 Ti will score about 665 points in Unigine Heaven, at about 26.4 frames per second. At the same settings, a Radeon HD 7850 will score about 706 points, at 28 fps. If you have a faster GPU than those cited here, your system should be able to beat these scores, but a slower GPU won’t be able to catch them.
Memory
The most common method of evaluating memory performance is via synthetic tests designed to ascertain peak bandwidth and latency. Performance variables include the operating frequency and capacity of the memory, and the number of channels that a given system uses.
AIDA64 Extreme Edition has an excellent built-in memory benchmark that tests read, write, and copy bandwidth, as well as latency; but it is available only as a limited trial unless you pay for the full edition of the tool.
The free edition of SiSoft SANDRA 2012 offers memory bandwidth and latency tests, too. It reports bandwidth scores in gigabytes per second (GBps) and latency in nanoseconds. The tests are easy to run and take moments to complete. An Intel Core i7-2700K-based system with 8GB of DDR3-1333MHz system memory running in a dual-channel configuration (two memory sticks) should offer about 16 GBps of bandwidth at an access latency in the 29ns range. Higher clocked memory should deliver more bandwidth and lower latency.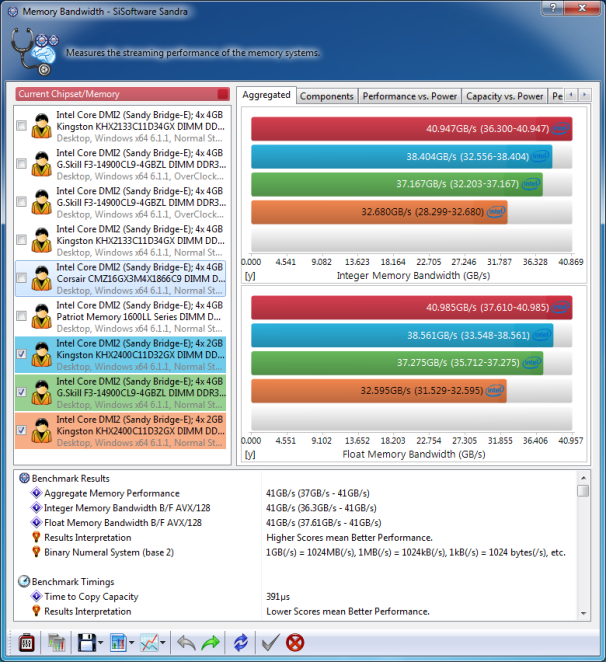
SiSoft SANDRA 2012’s Memory Bandwidth benchmarking tests peak bandwidth using both integer and floating point tests.
Drives/Storage
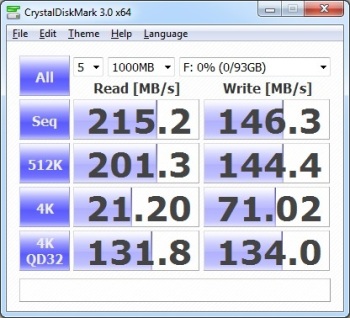 CrystalDIskMark is an excellent tool for testing a drive’s read and write performance at several different transfer sizes.
To test the performance of a hard drive or solid-state drive adequately, your best bet is to use a benchmarking that evaluates read and write transfer speeds (with both sequential and random workloads), as well as access latency. Trace-based tests, like those used in PCMark, that track performance over time with simulated application workloads are also beneficial.
One of the better free tools for testing a drive’s performance is CrystalDiskMark. This benchmark is particularly useful because it tests both sequential and random read and write speeds with both large and small block sizes, and with queue depths of up to 32. A SATA II Corsair solid-state drive earned the scores shown in the screenshot at right. Hard-disk drive scores will be much lower, but most newer SATA III SSDs will score higher.
CrystalDiskMark doesn’t report access latency, however, so it’s a good idea to use a tool such as HD Tune, IOMeter, or the Physical Disk Benchmark in SiSoft SANDRA 2012 for this purpose.
Total System Benchmarking
Among total system benchmarking, the rather basic Windows Experience Index (WEI) built into Windows 7 and Vista isn’t a good choice, owing to the rudimentary nature of the tests and the lack of granularity in the results. Instead consider using a suite such as BAPCO’s Sysmark or Futuremark’s PCMark 7; both are widely accepted and generate extensive results. Sysmark is expensive and tends to be difficult to run, however, whereas PCMark 7 is available in a free basic edition and can be run with a single click.
PCMark 7 runs a wide range of tests that tax CPU, GPU, memory, and disk performance; and it generates scores for each test–with higher scores reflecting better performance. PCMark 7 tends to emphasize disk/storage performance, but we’re fine with that. Upgrading from a hard drive to a solid state drive tends to be one of the best upgrades a user can make to improve system responsiveness, and PCMark 7’s results reflect that.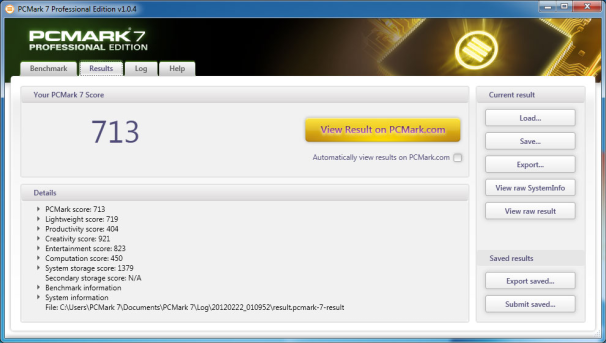 Futuremark’s PCMark 7 evaluates system performance by testing CPU, GPU, memory, and storage subsystem performance.
To give you a baseline for comparison, an Intel Core i7-2700K-based system with 8GB of RAM, a discrete Nvidia GeForce GTX 280 graphics card, and a 7200-rpm hard drive will earn a PCMark score of roughly 3800. Upgrade that same system with an SSD, and its score will jump to about 5100.
Digesting the Results
Most benchmarking scores are easy to understand. But keep in mind that higher scores don’t always point to better performance. On most benchmarks, higher frame rates or scores do mean that one system or component outperformed another; but some benchmarks are timed–and may output results in minutes or seconds. In such results, lower scores usually indicate better performance.
Important Notice: Tweet this article with the bookmark social media share below to stand a chance to win an ipad or start making money with your twitter account (it works only with your twitter account and the more articles you tweet the more you stand a chance to win an Ipad)